The source of price rigidity is a foundational question in macroeconomics, and one which improvments in data is consistently shifting our understanding of. I plan to regularly update this page, making the data publicly avaiable every three months, and uploading code (at the moment Stata, but soon Python and R) for those wishing to use it for reseach, or as a teaching aid. If you have any requests of comments on the data or papers please get in touch via Twitter (@RD_Economist) or email.
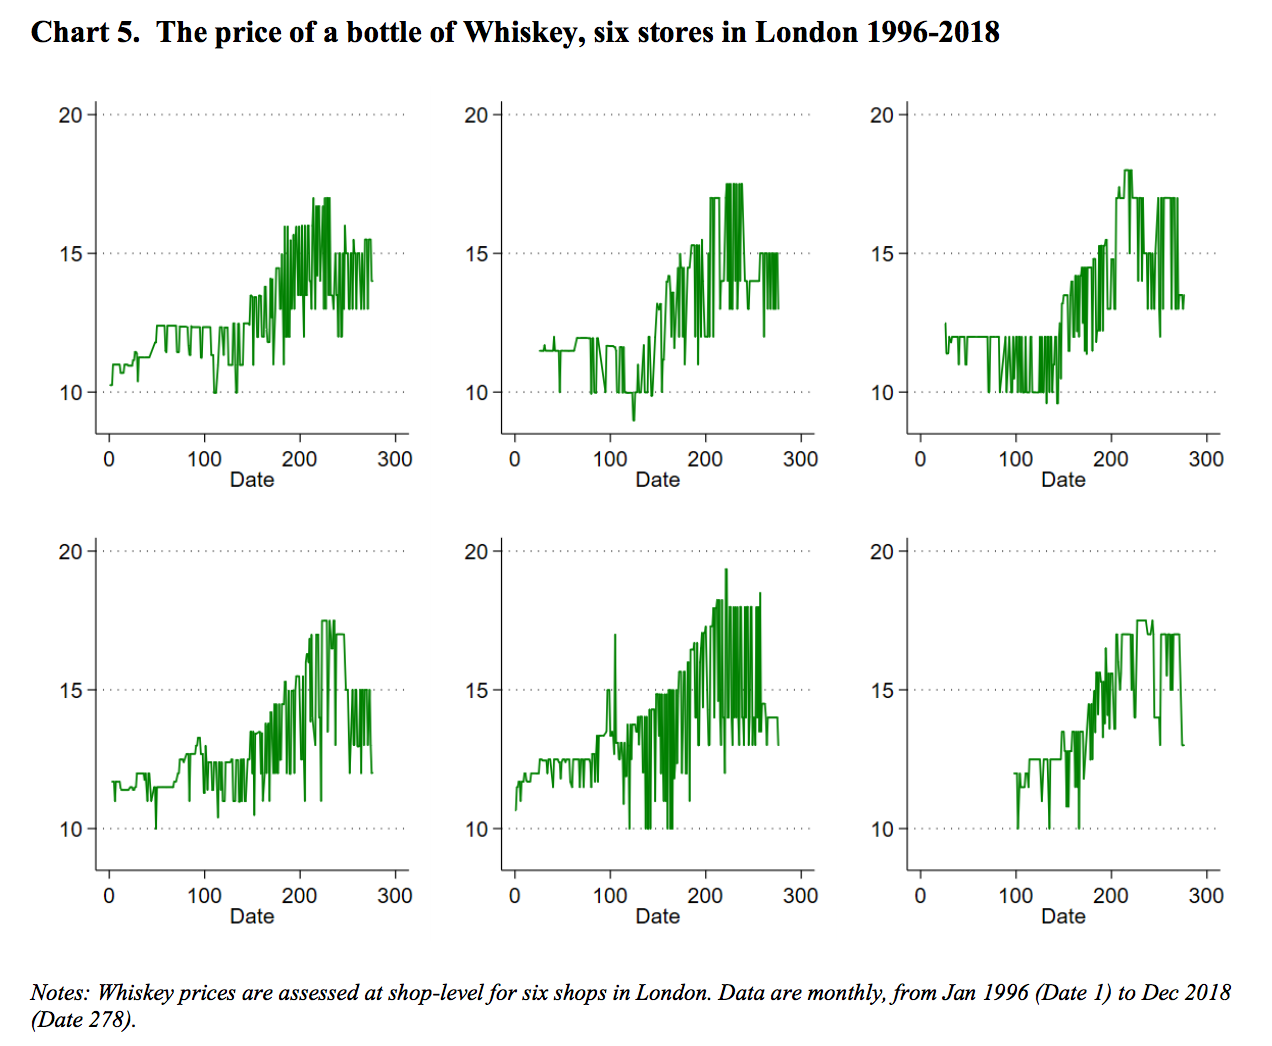
As part of my ongoing research this draft paper sheds new light on when, why and by how much firms in the UK change their prices. I also track how firms pricing behaviour reacts to shocks, and how the menu of prices UK consumers face varies over time and location. The data used are 'price quotes' that undeline the official UK inflation rate and are collected by the Office for National Statistics (ONS) (see links). The full data set (summer 2019) I am working on has 27m observations on price across 280 months for 1,227 unique items, sold in 3,668 different shops located across the 12 NUTS-1 regions of the UK. (Winter 2019 data to follow shortly...). Annexes containing charts and the assumptions made in the creation of the dataset are here.
The full data set is a jumble of products that dip in and out of the UK inflation rate. This reflects the fact that the people buy change over time. Despite this churn many goods and services are present for long time spans, including 172 items that are present across the entire sample, with around 11m observations on these ‘ever-present’ items. Since I am particularly interested in miss-allocation in economics my real focus here is on whether price dispersion is efficient (see e.g. this paper) and geographic pricing in the UK. For this reason products that only appear briefly are not particularly useful and most of the work is done with these ever-present items.
Data and code
Here are some files and simple lines of code for anyone interested in investigating this data.
First a health warning. This is NOT the official CPI data anymore. That data include all sorts of holes and gremlins that we have spotted and discussed with the ONS (these are all set out in the annexes to the paper above). In terms of answering research questions in economics this data should be more useful than the original files. But anyone seeking to simple re-create the CPI should use the ONS's unadjusted data.
Ever-present items. All. [Warning: large file]. Dta file here. Smaller file, with 10% sample (randomly drawn) of the master data set. Dta here and csv file here. I recomment running code on the small file until it works perfectly, then run it on the large.
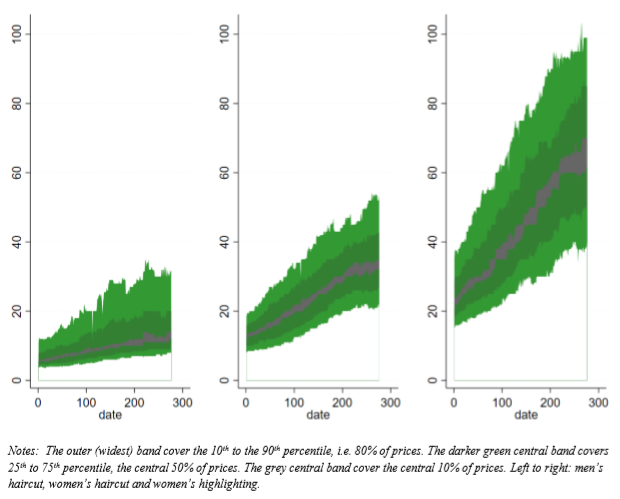
STATA do file, with the code needed to simplify the data, by tracking just the percentiles of the distribution, and for making a 'rivers of blood' style BoE swathe chart. Download here.
Some interesting charts
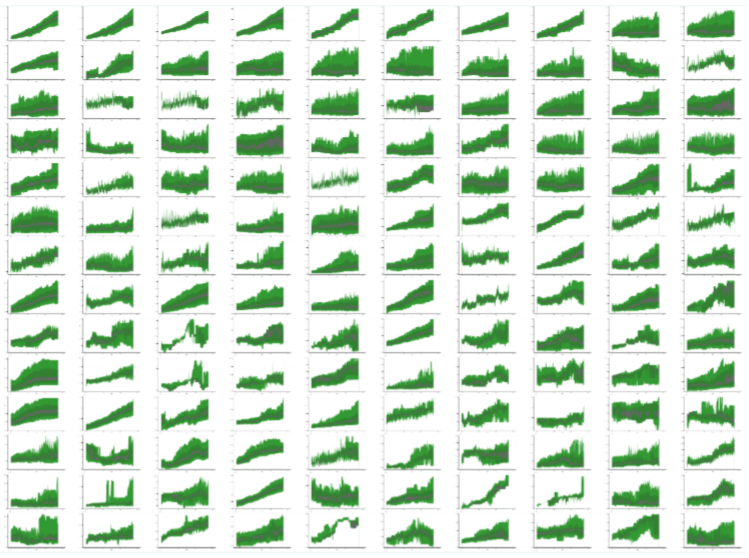
The top 140 products sampled in the UK CPI, between 1996 and 2018:
Men's hair cut, women's hair cut, and women's highlighting
Further reading
Klenow P and Malin B (2010), “Microeconomic Evidence on Price Setting”, prepared for the Handbook of Monetary Economics. https://www.nber.org/papers/w15826
Kehoe, Patrick and Virgiliu Midrigan (2014) “Prices are Sticky After All," Journal of Monetary Economics.
Midrigan, Virgiliu. “Menu costs, multiproduct firms and aggregate fluctuations.” Econometrica, vol. 79, no. 4, 2011, pp. 1139–1180. JSTOR, www.jstor.org/stable/41237858.
Nakamura, Emi and Jón Steinsson (2008), “Five Facts About Prices: A Reevaluation of Menu Cost Models,” Quarterly Journal of Economics 123 (November): 1415-1464.
Nakamura, Emi and Jón Steinsson (2013), “Lost in Transit: Product Replacement Bias and Pricing to Market”, American Economic Review 2012, 102(7): 3277–3316.
Nakamura, Emi & Jón Steinsson & Patrick Sun & Daniel Villar, 2018. "The Elusive Costs of Inflation: Price Dispersion during the U.S. Great Inflation*," The Quarterly Journal of Economics, vol 133(4), pages 1933-1980
Office for National Statistics (2018), "Consumer/Retail Prices Indices Microdata Metadata, 2017 - Edition Two", UK Data Service, 2nd Edition.